

Start with revenue after discounts and refunds. Subtract product, delivery, fulfillment and return costs, then reserve money for overhead, profit and other acquisition costs. What remains is your media spending ceiling. Count first orders and new customers separately, and test the downside before raising the budget.
A sale can look great in the ad account and leave very little in the bank.
Before you raise the budget, work out what one order leaves after the product, delivery, discounts, refunds and the cost of getting it out the door. Then decide how much of that money you can spend to win it.
This is a first-order spending limit, not a lifetime-value forecast. You can build it with your store records, fulfilment bills and advertising costs. No dashboard overhaul required.
Use the tools: Download the order economics calculator (Excel) for the worked example, editable inputs and a downside test. Download the illustrated worksheet and sign-off checklist (PDF) for your next budget conversation. The spreadsheet calculates; the PDF is fillable and printable. Neither needs an email address.
1. Pick the orders you are actually measuring
Start with a group of first orders placed by new customers in one period. Choose a currency, a timezone and a date when you will check their refunds again. Keep one row per order and a separate customer identifier so you can distinguish an order from a person.
You need:
- Order-level product charges, discounts, refunds, shipping collected and tax.
- Product costs, outbound delivery, packing, fulfilment, payment fees and return costs.
- Advertising spend plus the other acquisition costs you intend to include, such as campaign creative and agency fees.
- A sensible amount to retain for overhead and profit, agreed with whoever owns the finances.
Use an older group of orders whose normal return window and processing lag have passed. For a new offer, use a clearly labelled estimate based on similar products, then replace it with actual results. A week with no refunds yet is not evidence that refunds cost nothing.
Exclude test and duplicate orders. Record how you handle unpaid orders, cancellations, exchanges, chargebacks and replacements. A canceled order can still leave a fee or fulfilment cost; do not erase the cost because the sale disappeared.
This guide uses 100 paid first orders from 100 distinct new customers. All dollar amounts below are invented USD examples, not ZINC or client results. A fully refunded order remains in that original group of 100.
2. Find the money those orders keep
For this worksheet, retained revenue means product sales after discounts and product refunds, plus shipping income after shipping refunds. It excludes sales tax and duties collected for others. Keep all the inputs on that same basis.
| Per original first order | Illustrative amount |
|---|---|
| Product price before discounts | $100 |
| Less discounts | −$10 |
| Less product refunds and other product revenue reversals | −$8 |
| Add shipping collected, after shipping refunds | $4 |
| Retained revenue | $86 |
Across 100 orders, that is $8,600. Do not subtract the $8 again if your starting export already includes those refunds.
Shopify's sales report definitions distinguish net sales from total sales, which also includes items such as tax and shipping. They also explain why a reversal can land on a later date. For this calculation, match later adjustments back to the original order group rather than comparing an order month with an unrelated refund month.
An ad platform's purchase value may use a different basis. Write down what it includes before comparing it with your worksheet. Our ecommerce event validation guide helps you check what the website sends.
3. Subtract the cost of serving the order
Revenue does not tell you what is available for marketing. Subtract the costs that rise with these orders.
| Per original first order | Illustrative cost |
|---|---|
| Product cost, net of verified recovery on returned stock | $32 |
| Outbound delivery paid by the store | $8 |
| Packaging, picking and fulfilment | $4 |
| Payment and transaction fees actually retained by providers | $3 |
| Return labels, inspection and handling | $3 |
| Total order costs | $50 |
$86 retained revenue − $50 order costs = $36 before acquisition spending. That $36 is the order's contribution: the money left to help pay marketing, overhead and profit. It is not net profit.
Count shipping income and delivery cost separately. “Free shipping” removes the customer's charge; it does not remove your carrier bill. Keep refunded product value in the revenue section and return labels or handling in the cost section.
If returned stock is genuinely sellable again, use a documented cost recovery. Do not assume every return recovers its full cost, or count a write-off twice. Include chargeback losses and fees where applicable without also subtracting a loss already included in revenue reversals. Ask your bookkeeper to confirm the treatment.
Shopify's profit report guidance notes that product profit reporting depends on cost information recorded at the time of sale. Check missing costs before trusting the margin. For this budget decision, add the other order costs above rather than treating product gross profit as the full answer.
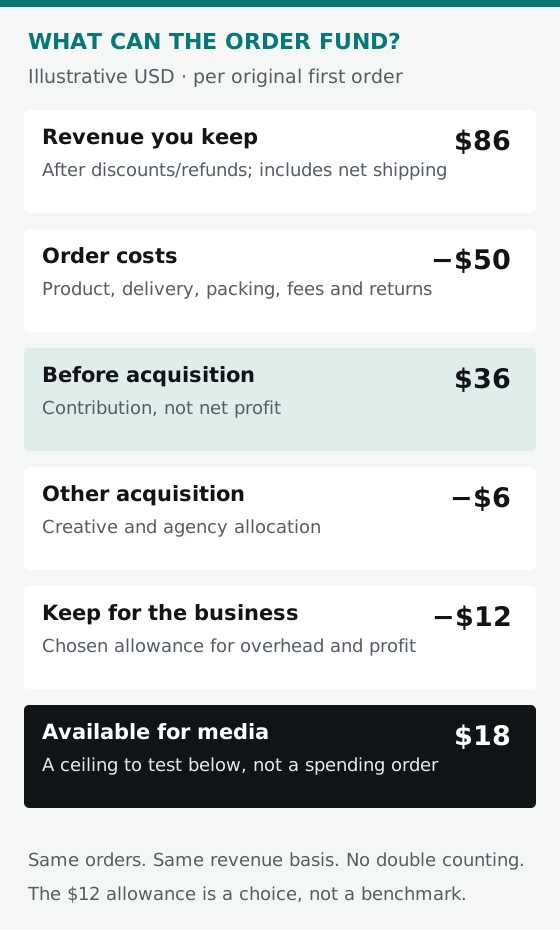
All amounts are per original first order in the same example. The $12 is a chosen business allowance, not an industry benchmark.
4. Give the remaining money a job
You could spend the whole $36 acquiring the customer and leave nothing from that first order for rent, salaries or profit. That is a break-even limit before overhead, not a comfortable budget.
In this example, the business wants to retain $12 per first order for overhead and profit. That leaves $24 for total acquisition costs.
It also allocates $6 per first order to campaign creative and agency fees. Those costs are outside the media budget, so the remaining media ceiling is $18 per first order.
Media ceiling per first order = retained revenue − order costs − other acquisition costs − amount retained for overhead and profit.
Here, $86 − $50 − $6 − $12 = $18.
Allocate shared creative and agency costs once, using a written rule. Do not charge the same fee to every channel and then add the channels together. Fixed overhead belongs in the business allowance unless you have deliberately allocated it elsewhere; avoid counting it twice.
If the answer is zero or negative, the first order cannot fund paid media while meeting your chosen allowance. Review the offer, costs or allowance before buying more traffic. Do not turn a negative answer into a positive target by dropping an inconvenient cost.
5. Keep cost per order and customer acquisition cost separate
Media cost per first order is advertising spend divided by the first orders in the group. Fully loaded customer acquisition cost, or CAC, is the acquisition spending you have defined divided by distinct new customers. A repeat order is not another new customer.
Our example happens to have 100 first orders and 100 new customers, so the denominators match:
- Media spend: $1,800 ÷ 100 first orders = $18 per first order.
- Other acquisition costs: $600 ÷ 100 new customers = $6 per new customer.
- Fully loaded CAC: ($1,800 + $600) ÷ 100 new customers = $24.
- Money retained: $8,600 − $5,000 − $1,800 − $600 = $1,200, or $12 per original first order, before overhead and profit are paid.
In a real business, advertising spend may also support repeat orders and people who do not buy. Explain the allocation and call an unallocated storewide number a blended measure. Do not label it a channel's proven CAC.
Two ad platforms can both claim the same sale. Adding those reported purchases does not produce a count of unique new customers. Use store order and customer records for that count, and state that attribution cannot prove how many sales the advertising caused.
6. Translate the ceiling into a useful ROAS check
Return on ad spend, or ROAS, divides the purchase value being measured by media spend. Google explains that relationship in its Target ROAS guidance. The value you send is part of what determines the number you see.
On this worksheet's retained-revenue basis, $86 ÷ $18 gives about 4.78× ROAS, or 478%. That is the illustrative media ceiling translated into a revenue ratio. It is not a target to copy into an ad account that reports gross sales, tax, different refunds or a different customer mix.
With the same $6 of other acquisition cost but no $12 allowance, the media-only break-even ceiling would be $30. That is $86 ÷ $30, or about 2.87× ROAS, before overhead and profit. You can hit that ratio and still have no money left for the business.
Use ROAS as a cross-check on a defined calculation. It cannot replace the order costs, and a bidding target does not guarantee an achieved result.
Before changing a Shopping campaign, check the product mix and feed as well. Our Shopify launch guide covers the store and product-data foundations; an affordable order still needs a working checkout.
7. Test the offer before you scale it
The calculator includes a downside scenario. Keep the allowance and other acquisition costs visible while changing the parts of the offer that move.
| Change from the example | Revised media ceiling |
|---|---|
| No change | $18 |
| Another $5 discount, with other inputs unchanged | $13 |
| Another $4 in product refunds plus $1 in return handling | $13 |
| Another $5 discount and $2 in outbound delivery | $11 |
These are simple sensitivity tests, not forecasts. A promotion can change conversion rate, order value and product mix as well. Calculate from the expected basket, then check the actual orders.
Do not fund today's budget with repeat purchases you have not demonstrated. If the business deliberately accepts a first-order loss, agree the cash limit, payback deadline and evidence for repeat-order contribution. Revenue alone is not payback.
Sign off the number, then review the orders
Before using the ceiling, complete these checks. The downloadable PDF gives you a place to record the evidence and the person responsible.
- Scope: the dates, currency, timezone and original order/customer counts are written down.
- Order quality: duplicates, tests, unpaid orders and cancellations have a stated treatment; their real costs are not silently lost.
- Revenue: discounts and refunds are included once; tax and duties are excluded; shipping income is net of shipping refunds.
- Returns: later refunds are matched to original orders, with a stated return-maturity date or clearly labelled estimate.
- Costs: product, delivery, fulfilment, fees, returns and applicable chargeback losses are covered; missing costs remain visible.
- Recovery: returned inventory recovery is supported and no refund, fee or write-off is counted twice.
- Acquisition: media and other acquisition costs are separate, with shared-cost allocation documented.
- Denominators: first orders and distinct new customers are counted separately; platform attribution totals are not added together.
- Allowance: finance has agreed what must remain for overhead and profit, and checked that it is sufficient for the business.
- Reconciliation: the per-order figures multiplied by the original order count match the group totals; differences have explanations.
- Downside: the offer still works under a realistic discount, delivery and return scenario, or has an explicit stop condition.
- Ownership: someone owns the weekly check and the review after the return window; any planned loss has a cash limit and payback deadline.
Start with a controlled budget below the ceiling, not an automatic instruction to spend up to it. Review the actual retained revenue, costs and customer mix each week. Recheck after returns mature and after a meaningful change to price, delivery or the offer.
If the totals do not reconcile, hold the increase and fix the inputs. If the economics no longer work, the answer may be a better basket, a delivery change or a different promotion. More advertising is only one option.
Bring the calculator and worksheet to that conversation. A clear spending limit gives your store team, finance lead and agency something useful to agree on before the next campaign goes live.
Sources
- sales report definitionshelp.shopify.com
- profit report guidancehelp.shopify.com
- Target ROAS guidancesupport.google.com